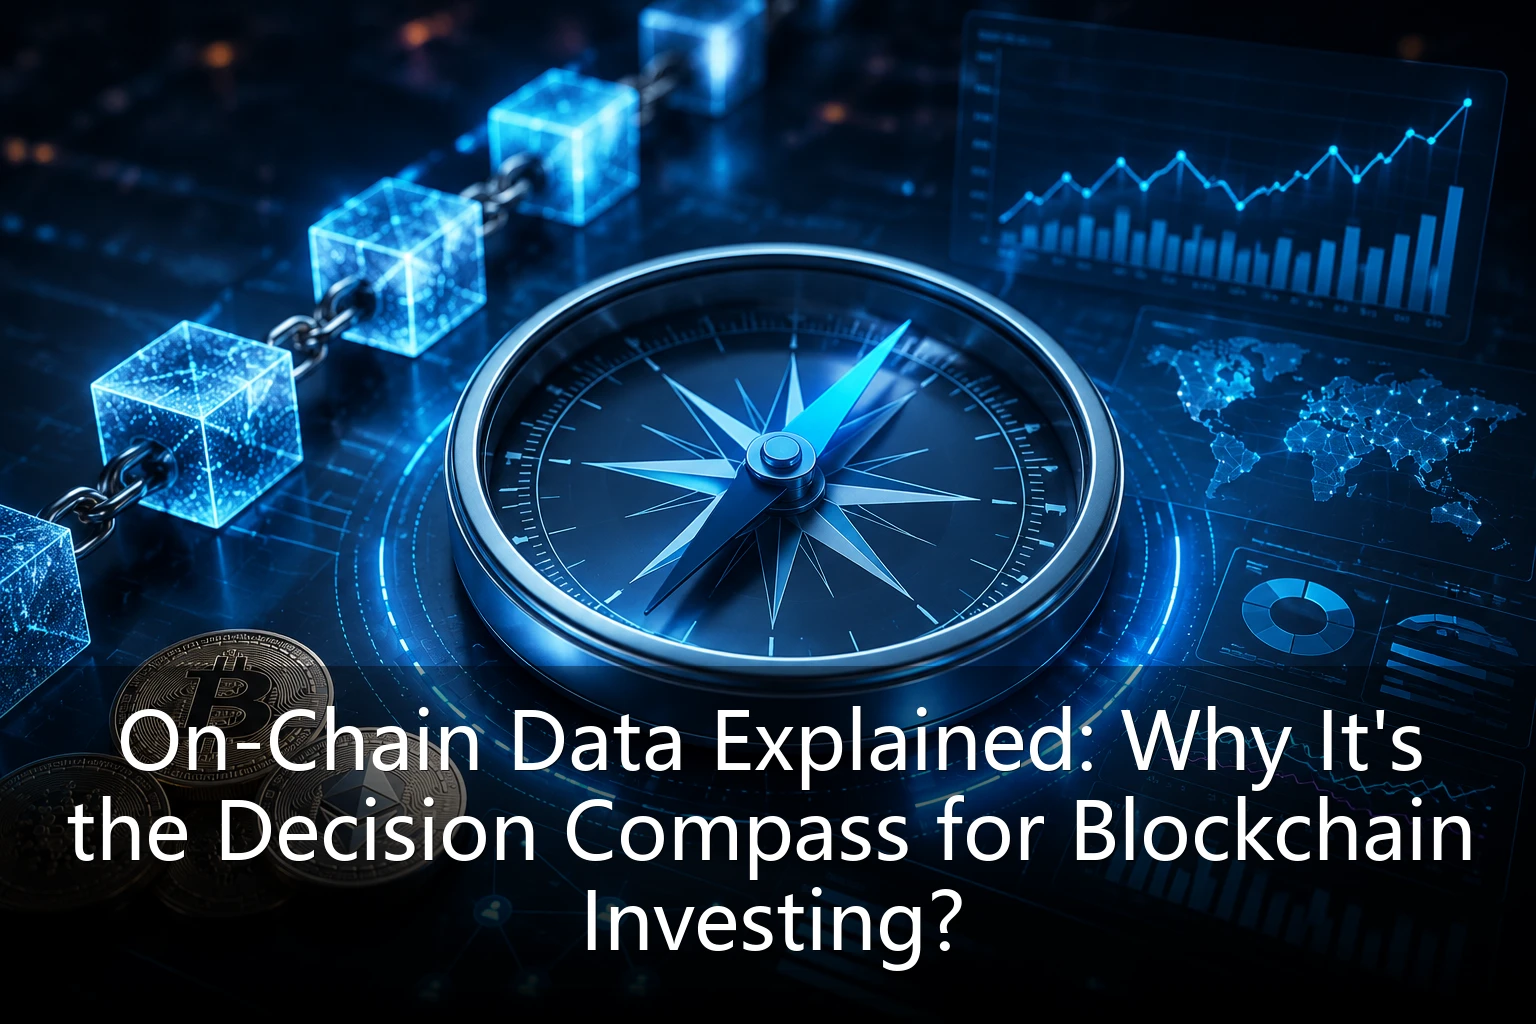
On-Chain Data Explained: Why It's the Decision Compass for Blockchain Investing?
In the highly volatile and information-overloaded crypto market, ordinary investors are often swept along by candlestick charts, news headlines, and social media sentiment, making irrational buy and sell decisions. Yet what truly determines a blockchain network's long-term value and short-term price action is often the "on-chain data" hidden deep within block explorers. Understanding on-chain data is like having an X-ray machine that peers into the inner workings of the crypto market. This article systematically explains the core concepts, key metrics, operating mechanisms, and practical investment applications of on-chain data.
1. What Is On-Chain Data? How Does It Differ from Traditional Market Data?
On-chain data refers to all verifiable information directly recorded on the blockchain network, including every transaction's sender, receiver, amount, timestamp, gas fees, smart contract calls, and address balance changes. Because the blockchain itself is a public, transparent, and immutable distributed ledger, anyone can query this information through block explorers or professional data analytics platforms.
By contrast, traditional market data (such as candlestick charts and price curves) reflects information at the order-matching level—essentially the "result," telling you how much the price rose and how large the volume was. On-chain data, however, reflects the "process"—telling you who is buying, who is selling, where funds come from, where they ultimately flow, and what holders are doing. This shift from "result-oriented" to "process-oriented" thinking is the core value of on-chain data analysis.
2. Key On-Chain Metric System
To make on-chain data truly serve investment decisions, a systematic metric framework is needed. Below are the core categories most commonly watched by investors:
2.1 Active Addresses
Active addresses refer to the number of unique addresses that conducted on-chain transactions within a specific period (usually 24 hours). It is the most intuitive metric for measuring network activity. A sustained rise in active addresses suggests growing network usage and potential ecosystem expansion; the opposite may indicate user attrition. Note that since one user may control multiple addresses, this metric tends to be somewhat overstated, but it remains an important trend reference.
2.2 Transactions & Volume
Transaction count reflects the frequency of on-chain activity, while transaction volume (in native tokens or USD) reflects the scale of capital flow. Importantly, on-chain transaction volume differs fundamentally from exchange-reported volume—the latter includes large amounts of wash trading and spoofing, while on-chain volume is real and impossible to forge. Investors should be wary of assets whose on-chain volume severely diverges from price action, as this is often a signal of market manipulation.
2.3 Address Distribution
By analyzing the number of addresses across different balance ranges, you can assess token holding concentration. If the top 100 addresses hold more than 50% of the total supply,筹码 are highly concentrated and pose a dump risk. A healthy token distribution typically shows a "long-tail" pattern: many addresses hold small amounts while a few hold large amounts. The "Coin Days Destroyed" metric proposed by institutions like Glassnode can further reveal behavioral shifts among long-term holders.
2.4 Exchange Netflow
Exchange netflow is a key metric for gauging short-term market sentiment. When large amounts of tokens flow from personal wallets to exchanges, holders are typically preparing to sell—a potential bearish signal. Conversely, when tokens flow heavily from exchanges to personal wallets, investors tend toward long-term holding—a potential bullish signal. This metric has proven especially predictive for major coins like BTC and ETH.
2.5 Miner and Staker Behavior
For PoW chains (such as BTC), miner revenue, hashrate changes, and mining pool balances are important references. Miner selling typically creates short-term price pressure. For PoS chains (such as ETH 2.0), validator staking amounts, exit queues, and yield changes reflect long-term holder confidence.
3. How On-Chain Data Works and Where It Comes From
On-chain data is generated by the blockchain's underlying architecture. Each transaction is broadcast to the network, validated, packed into a block, and permanently recorded on-chain through the consensus mechanism. Professional analytics platforms (such as Glassnode, CryptoQuant, Nansen, and Token Terminal) run full nodes, continuously sync on-chain data, and transform raw data into readable metrics through cleaning, aggregation, and modeling.
For Bitcoin, raw on-chain data reaches tens of gigabytes per day, but after processing, the key metrics are lightweight and easily accessible to ordinary investors via APIs or web interfaces. For smart contract platforms like Ethereum, contract event logs must also be parsed to obtain more granular data on DeFi protocols and NFT markets.
4. How Does On-Chain Data Influence Investment Decisions?
On-chain data should not be used in isolation but combined with market sentiment, macroeconomics, and technical analysis to form a multi-dimensional decision framework. Below are several typical practical scenarios:
- Identifying Bottoms and Tops: When exchange BTC balances fall to multi-year lows while long-term holder share rises, it is often a historic buying opportunity. When exchange balances surge and short-term holders take profits, be alert to pullback risk.
- Tracking Smart Money: Use label systems on platforms like Nansen to track on-chain moves of well-known institutions and whale addresses, allowing you to follow them when they accumulate or exit early when they distribute.
- Assessing DeFi Protocol Health: Use on-chain metrics such as TVL (Total Value Locked), protocol revenue, and active users to judge whether a DeFi project's fundamentals are solid, avoiding projects that look prosperous on the surface but are actually idle.
- Detecting Market Manipulation: If an altcoin's price surges sharply while on-chain transaction count is tiny and active addresses stagnate, it is likely a trap where the team pumps before dumping.
5. Caveats and Limitations of On-Chain Data
Although on-chain data is immutable and highly transparent, it is not an all-seeing "crystal ball." Investors should keep the following in mind:
First, on-chain data has latency. Block confirmation takes time, and data processing also involves delays, so on-chain metrics are better suited for medium-term trends than short-term high-frequency trading.
Second, address attribution remains limited. Although analytics platforms continue to enrich address labels, many addresses still cannot be clearly attributed—especially funds that have passed through mixers.
Third, on-chain data must be interpreted in context. An abnormal move in a single metric may stem from many causes, such as internal exchange transfers, protocol upgrade airdrops, or on-chain governance votes. Applying templates without analysis can lead to misjudgment.
Fourth, on-chain data cannot capture off-chain information. Factors such as team execution, regulatory environment, and macroeconomics also profoundly affect asset prices and must be considered alongside on-chain data.
6. Build Your On-Chain Analysis Workflow
For investors who want to systematically use on-chain data, the following steps are recommended: First, clarify whether your target is a major coin or an altcoin—major coins have a more mature on-chain data ecosystem and more complete metrics. Second, choose 1–2 reliable data platforms (e.g., Glassnode for BTC and ETH, Nansen for smart money, Token Terminal for protocol revenue). Third, build your own indicator dashboard focused on 3–5 core metrics to avoid information overload. Finally, combine on-chain signals with traditional technical analysis and macro judgment to form a complete trading decision.
Conclusion
On-chain data is a unique, unforgeable information source in blockchain investing. It allows investors, for the first time, to see through market appearances and observe the true direction of capital flows. In a crypto market plagued by severe information asymmetry, mastering on-chain data interpretation means holding a key that unlocks the door to Alpha. But remember: tools are just tools. Final decisions still depend on the investor's depth of insight, risk control ability, and long-term discipline. Treat on-chain data as a decision compass, not a prediction oracle, and you will navigate the volatile crypto market with steady progress.