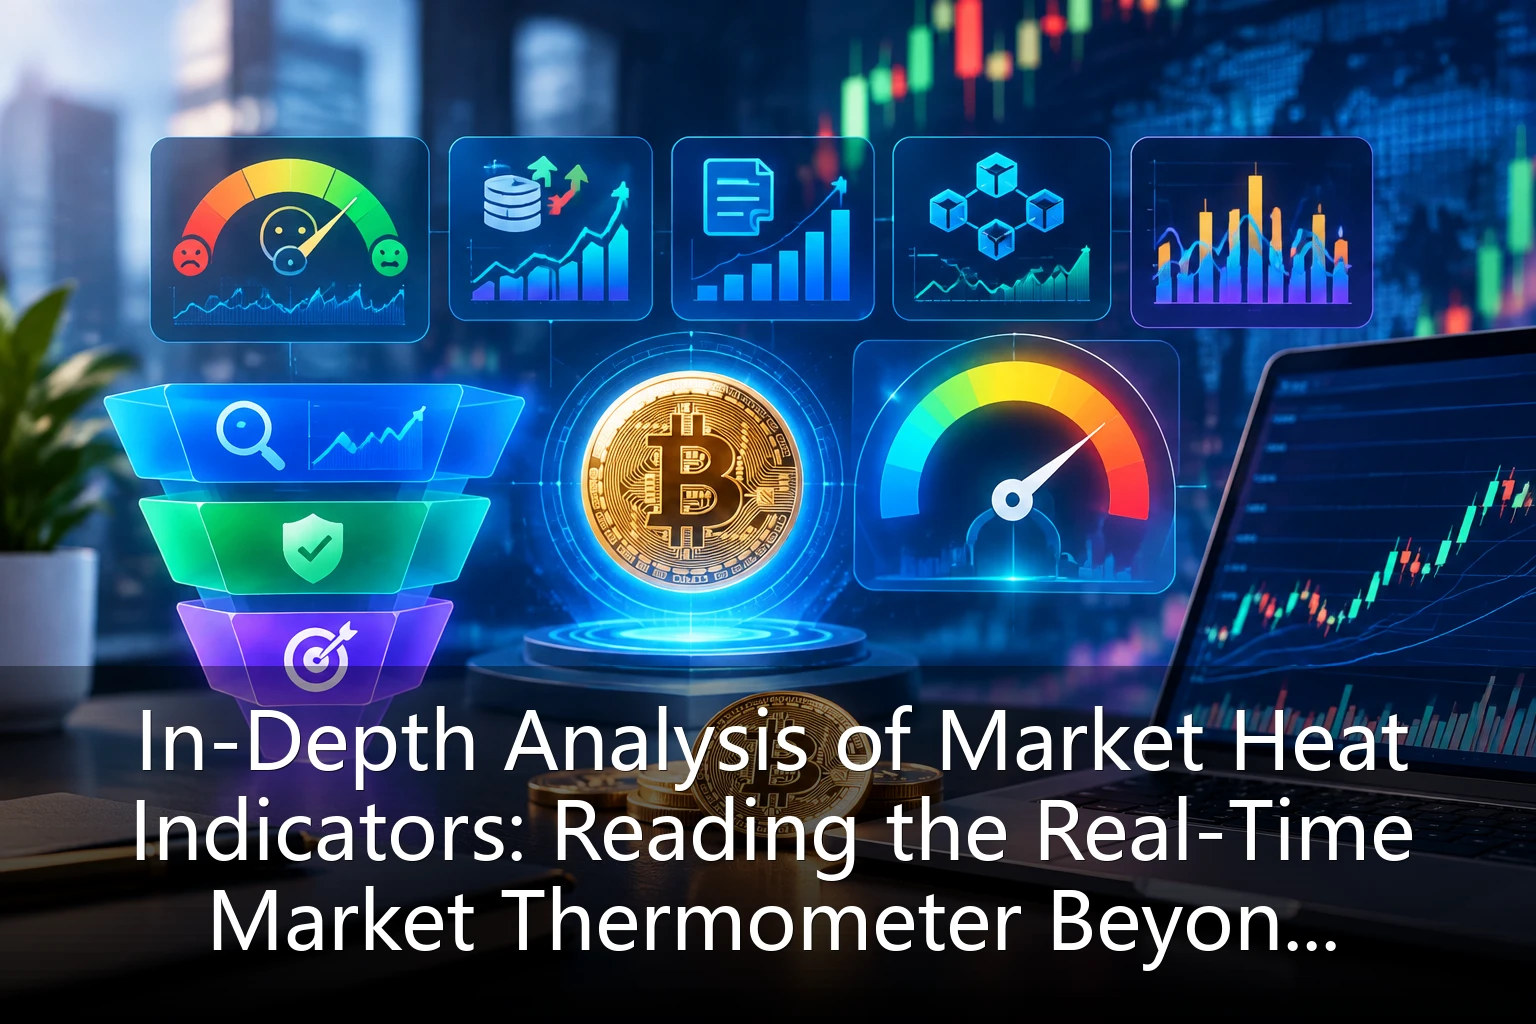
When opening a market app, most investors' eyes go straight to the ticking spot price. Yet price is only the outcome of market tussles; what truly determines the next move often hides in the market heat indicators behind the price. This article systematically breaks down the most commonly used heat indicators in the crypto market, helping you build a more complete, forward-looking market observation framework beyond the blockchain spot price.
Why Watching Only the Spot Price Always Leaves You a Step Behind
The spot price reflects the consensus just reached between buyers and sellers, but it alone won't tell you: how much of this rally is driven by leveraged capital? Has euphoria overheated? Are chips concentrating in the hands of big players or spreading to retail investors? Price alone cannot directly answer these questions.
Here's an analogy: the spot price is like the reading on a thermometer, while market heat indicators are heart rate, blood pressure, and blood oxygen. A rising reading may be normal fluctuation—or the body sounding an alarm. Trading on price alone is like diagnosing an illness by temperature only; combining price with heat indicators is the only way to judge how healthy this market move really is.
Five Core Market Heat Indicators, Broken Down One by One
1. The Fear & Greed Index: The Master Switch of Market Sentiment
The Fear & Greed Index blends volatility, trading volume, social media buzz, and market momentum into a single value from 0 to 100. In practice, when the index lingers in the extreme greed zone, the market has often already priced in excessive optimism and the odds of a pullback rise; when it falls into the extreme fear zone, medium- to long-term accumulation windows often emerge. Importantly, sentiment indicators work best as contrarian references, not direct entry signals.
2. Funding Rate: The Balance of Leveraged Longs vs. Shorts
The funding rate of perpetual contracts is the most direct gauge of leveraged sentiment. When the rate stays persistently positive and elevated, longs are paying a premium to hold positions—a sign of overheated sentiment; once upward momentum stalls, waves of long liquidations can amplify losses. Conversely, a deeply negative rate usually means shorts are crowded, often setting up a short-squeeze rebound. Comparing the funding rate against the spot price quickly reveals whether the current trend is advancing healthily or propped up by leverage.
3. Open Interest: A Thermometer for Inflowing Capital
Open interest represents the total value of contracts not yet settled. When prices rise alongside expanding open interest, fresh capital is usually entering, giving the trend more staying power; if prices hit new highs while open interest shrinks, the rally may be hollow, driven by short covering. Cross-checking open interest changes against price direction is a fundamental skill for judging market quality in the derivatives era.
4. On-Chain Activity and Exchange Net Flows: Where Are the Coins Moving?
On-chain data is a transparency advantage unique to crypto. Active address counts and large-transfer frequency reflect real usage and capital participation; rising net inflows to exchanges often signal holders preparing to sell, with selling pressure looming; sustained net outflows may indicate long-term capital withdrawing coins to hold. For investors accustomed to traditional financial statement analysis, on-chain heat indicators serve as a balance sheet updated in real time.
5. Volume and Volatility: The Market's Breathing Rhythm
Rising prices on expanding volume show consensus building, while grinding declines on shrinking volume often signal liquidity draining away. Volatility that suddenly expands after a long period of compression at low levels usually points to an imminent key turning point. Watching the combined pattern of volume and volatility helps determine whether the current move is in the middle or at the end of a trend.
Assembling Heat Indicators and Spot Price into a Decision System
A single indicator is noisy; in practice, a three-layer filter is recommended:
- Layer one—direction: confirm the current trend using spot prices of major coins relative to key moving averages;
- Layer two—quality: validate the substance of this price move with trading volume, open interest, and funding rates;
- Layer three—extremes: when sentiment indicators such as the Fear & Greed Index and funding rates enter historical extremes, prepare position-reduction or contrarian plans in advance.
For example, if the spot price hits a new high while open interest shrinks, funding rates overheat, and the sentiment index enters the extreme greed zone, that's a classic divergence of strong price and weak heat—prudent investors should trim positions rather than chase the rally. Conversely, when prices hover at lows, on-chain net outflows persist, and the sentiment index sits deep in fear territory, that signal combination is worth referencing for phased accumulation.
Common Misreadings and Risk Warnings
- Misconception one: treating any single indicator as the holy grail. Heat indicators are probability tools, not prediction tools—they must be used in combination and cross-validated.
- Misconception two: ignoring an indicator's historical percentile. The same value means something entirely different at a historical low versus high percentile; comparison matters more than absolutes.
- Misconception three: using high-frequency indicators to guide ultra-long-term decisions. Sentiment indicators suit medium- to short-term rhythm management; long-term allocation should still return to asset fundamentals and position discipline.
Also, leveraged investors should be especially wary of indicator dulling: when the market enters a one-sided extreme move, indicators may stay pinned at extreme levels for long stretches, and the risk of heavy counter-trend positions far outweighs the rewards. At no point should stop-loss discipline and position limits be replaced by indicator signals.
Conclusion: Let Data Cool You Down, Let Discipline Do the Execution
The crypto market's appeal and risks both stem from its high volatility and emotional swings. The blockchain spot price tells you where you are now; market heat indicators hint at where you might be headed next. For investors seeking long-term survival amid volatility, building a two-dimensional observation system of price plus heat is far more valuable than predicting any specific price level. In upcoming market quick-check and on-chain data interpretation features from Chuangjin Strategy, we will keep applying this framework to daily real-time market tracking, helping readers turn cold data into executable asset allocation plans.